The Quantification and Analysis of Second Balls in Football Part 1
The evaluation of in-game actions of football players and how they affect the outcome of a game is an important part of football analytics (Link, 2018). Unlike traditional statistics that focus on goals and assists, evaluating other actions that players perform looks deeper into the nuances of player behaviour and decision-making.
An action that often goes unnoticed is the ability to win second balls (Hang, 2023). A second ball is a possession gain following an intervention from an attempted long pass. Simply put, a second ball occurs after the ball is kicked long and neither team clearly controls it. Instead, the ball bounces, gets deflected, or is contested, and then players rush to try and take control of the ball. A quote from Pep Guardiola, one of the most successful football managers of all time, states the importance of winning second balls, ”The main thing in English football is to control the second ball. Without that, you cannot survive.” (Wilson, 2016).
Despite the importance of winning second balls, there is a lack of research quantifying or analyzing the value of winning second balls and how to do so successfully. Therefore this part 1 of 2 post aims to extend the research done and pose future direction for further work/extensions.
Definition and Example
Let’s begin by establishing a working definition for second balls. The following definitions have been adapted from a blog post by Chun Hang, but remain largely unchanged since I think they are a great definition.
- Long Pass (long ball): A pass with a length of 20 metres or greater that any player meets, successful or not.
- Interventions: The first point of contact with the long ball must be an intervention. This intervention can be in the form of an aerial duel between players, a clearance attempt, or miscontrol. The key part of the interaction is that it leads to a loose ball.
- Possession Gain/Regain: A player controls the second ball gaining or regaining possession for their team. Including the player with the ball, their team must complete two successful actions to be considered a second ball win.
And to further build intuition for those who are less familiar with second balls, I think seeing a real example does a great job.
It is clear from the example that second balls can lead to chaotic and quick transitional moments. Before beginning to quantify them, let’s investigate their importance a little bit more.
Importance of Second Balls
The following brief analysis examines the relationship between second ball success, goal difference, and overall team performance. It should not be taken as fact but rather a thought provoking analysis to give reason why we should investigate second balls further.
League Performance
Using data from the top 5 European leagues in 2015/2016, a linear regression is performed on goal difference (GD) vs total points earned in a season.
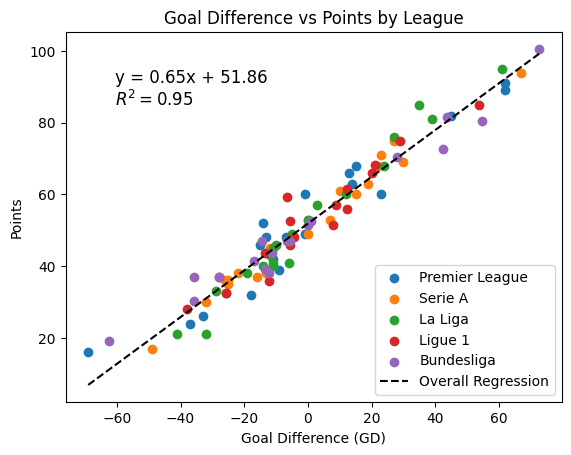
An R² value of 0.95 demonstrates a strong linear relationship between GD and points. Based on the regression an increase in GD by 1 corresponds to an expected points increase of 0.65 points. Potentially even marginal improvements in GD can affect a team’s league standing position.
Shot Creation
Now, let’s look at the role second balls play in generating goal-scoring opportunities. The following information is extracted from the dataset:
- 19.38% of second ball wins result in a shot within the following possession.
- The average expected goal (xG) value per shot is 10.1%.
- On average teams contest approximately 24 second balls per game.
The above list suggest increasing second ball wins could lead to a higher number of shots for a team. Also note, expected goals is a metric that predicts the probability that a shot results in a goal by using various features such as distance to goal, angle to goal, etc.
Impact of Winning More Second Balls
Now let’s look at the potential impact on a team that wins an additional 5 second balls per match. Based on the dataset:
- Approximately 0.97 additional shots per game, or 36.81 additional shots per season (for a standard 38 game season).
- Given an average xG per shot of 0.101, this translates to 3.72 expected goals gined per season.
- Conversely, by preventing the opponent from winning these second balls, a team can reduce shots conceded, preventing 3.72 expected goals against per season.
- Thus, a team could see a net gain as large as 7.44 GD per season.
Translating Second Ball Success to League Points
Finally, by using the regression model, a 7.44 GD corresponds to an additional 4.84 points over a season. It may not seem like much, but minor differences in points can define team’s seasons as success or failure. Below is the league table from the 2015/2016 premier league, where the data is taken from.
| Rank | Team | Points |
|---|---|---|
| 1 | Leicester City | 81 |
| 2 | Arsenal | 71 |
| 3 | Tottenham | 70 |
| 4 | Manchester City | 66 |
| 5 | Manchester United | 66 |
| 6 | Southampton | 63 |
| 7 | West Ham | 62 |
| 8 | Liverpool | 60 |
| 9 | Stoke City | 51 |
| 10 | Chelsea | 50 |
| 11 | Everton | 47 |
| 12 | Swansea City | 47 |
| 13 | Watford | 45 |
| 14 | West Brom | 43 |
| 15 | Crystal Palace | 42 |
| 16 | Bournemouth | 42 |
| 17 | Sunderland | 39 |
| 18 | Newcastle | 37 |
| 19 | Norwich City | 34 |
| 20 | Aston Villa | 17 |
It is clear to see minor point differences between Newcastle (37) and Sunderland (39). Two points was the difference between relegation and staying in the Premier League. Also, 4 points seperate 4th-7th, the difference between two European spots. Given the stakes, I argue that for certain teams, improving second ball success could potenitally be season changing.
Other Second Ball Research
To date, only one research paper has directly analyzed second balls, while few online blogs/articles offer exploratory analyses ((Hang, 2023) and (Carey & Walid, 2025)).
Sunjic et al. analyze how second ball wins correlate with technical performance such as shots, passes, and dribbles. Carey and Walid provide really cool graphics about premier league teams abilities from winning second balls to even looking at the number of defensive vs offensive second balls won for each team. While both very interesting, neither provide a clear mathematical definition that allows for algorithmic extraction.
Hang addresses this problem by creating an idea called “Second Ball Chains”, a chain of events that denote the actions leading up to a second ball. An example can be found below.
The two problems I am trying to address in this post are:
- Naming Conventions
- Higher-order balls (third balls, fourth balls, and so on)
Second Ball Chains
The original second ball chains naming convention can be confusing. For example, ABABA means Team A long ball, followed by an aerial duel in which Team B wins, followed by Team A gaining the ball from the duel. I argue this is not clear from the above example. Instead it should look something like this (ADBA):
So instead of only using A’s and B’s, we incorporate ‘D’ for duel to help clarify the chains. Also a ‘w’ is added to the end of a chain to denote a second ball win. For example, ADBA is a second ball, where ADBAw is a second ball win, meaning possession is successfully established. This is another distinction that seperates these chains from Hang’s. A summary of all of our chains will be provided below.
Higher Order Balls
Also, second balls follow a strict set of chains and leave out other scenarios that are very similar. Currently a team is only awarded a second ball win if they complete 2 successful actions. However, what about when neither team intially gains possession and instead the ball hops back and forth between teams a few times before someone establihses possession. These scenarios can be though of as third balls, fourth balls, and so on, depending on how long it stays in this transitional state. Although they are not second balls, I still include them since they serve the same purpose; helping to understand the relationship between chaotic interactions after a long ball and how they affect goal-scoring opportunities. We call this new concept, Higher-Order Balls, and use the following definitions to describe them.
A ‘T’ can be used to denote a transition period. So ADBA which is above, can also now be extended further into two higher-order ball scenarios, ADBATA and ADBATB.
Updated Chains
With the new naming conventions the following second ball chains can be summarized:
| Chain | Description |
|---|---|
| ABA | Team A long ball, Team B pass/clearance, Team A gets ball |
| ABB | Team A long ball, Team B pass/clearance, Team B gets ball |
| ADBA | Team A long ball, Team B wins duel, Team A gets ball |
| ADBB | Team A long ball, Team B wins duel, Team B gets ball |
| ADAA | Team A long ball, Team A wins duel, Team A gets ball |
| ADAB | Team A long ball, Team A wins duel, Team B gets ball |
| ABATA | ABA, transition period, Team A establishes possession |
| ABATB | ABA, transition period, Team B establishes possession |
| ABBTA | ABB, transition period, Team A establishes possession |
| ABBTB | ABB, transition period, Team B establishes possession |
| ADBATA | ADBA, transition period, Team A establishes possession |
| ADBATB | ADBA, transition period, Team B establishes possession |
| ADBBTA | ADBB, transition period, Team A establishes possession |
| ADBBTB | ADBB, transition period, Team B establishes possession |
| ADAATA | ADAA, transition period, Team A establishes possession |
| ADAATB | ADAA, transition period, Team B establishes possession |
| ADABTA | ADAB, transition period, Team A establishes possession |
| ADABTB | ADAB, transition period, Team B establishes possession |
Note that for the first 6 chains, a ‘w’ can be added to the end to denote a second ball win. For the latter 12, since a transition period ends with establishing possession, they inherently are wins and do not require a ‘w’.
Second Ball Possessions
Now that we have updated second ball chains, we now define what happens after a second ball win: a second ball possession. The following defintion sets up future analysis (my next post).
Mathematical Definition of Second Ball Wins
Now we define them mathematically to allow for automated extraction from a dataset.
Let’s define a second ball sequence $S$ that begins at time $t_0$ when a second ball occurs. Let $T$ be a team and $W_s$ be a second ball win.
\[W_s = \begin{cases} 1, & \text{if } T \text{ completes 2 consecutive passes within } t_0 + \tau \\ 0, & \text{otherwise} \end{cases}\]where $\tau$ is the transition window. The transition period is defined as:
\[T_{trans} = [t_o, t_f]\]where $t_f = min(t_{S_{A}=2}, t_{S_{B}=2}, t_0 + \tau)$ and $t_{S_{x}=y}$ is the time $t$, at which team $x$ makes $y$ successful actions.
Once $t_f$ is reached, the possession of the winning team is tracked, let’s say $P_T$, until one of the following:
- Possession loss, that is, the opposing team completes two consecutive successful actions, a foul, an out of bounds, or any other stoppage.
- Goal
Formally:
\[P_T = \{a_{T_1}, a_{T_2}, \ldots, a_{T_n}\}\]where $a_{T_i}$ is the $i$th successful action by team $T$. Therefore, $a_{T_n}$ is a possession loss or a goal.
Extraction
With definitions created, 10 games were manually anontated and second balls were sorted into the correct chain categories. Then using python, automated second ball chain extracting functions were created and can be found in the following repo: Second Ball Extracting Functions.
Results
Finally, we have a few results. Similiarly to Hang, we can create a rankings for players and teams of second ball wins. Furthermore, we can create visuals that show the locations of every second ball win on a player and team level.
Second Ball Rankings
| Player | Team | Amount | p90 |
|---|---|---|---|
| Danny Drinkwater | Leicester City | 95 | 2.82 |
| Andrew Surman | AFC Bournemouth | 84 | 2.21 |
| Glenn Whelan | Stoke City | 77 | 2.19 |
| Yann M’Vila | Sunderland | 73 | 2.06 |
| Idrissa Gana Gueye | Everton | 71 | 2.08 |
| Victor Wanyama | Southampton | 71 | 2.55 |
| Darren Fletcher | West Brom | 70 | 1.87 |
| Gareth Barry | Everton | 68 | 2.16 |
| Mark Noble | West Ham | 68 | 1.92 |
| Claudio Yacob | West Brom | 67 | 2.15 |
| N’Golo Kante | Leicester City | 67 | 1.99 |
| Eric Dier | Tottenham | 66 | 1.82 |
| Cesc Fabregas | Chelsea | 65 | 2.02 |
| Ashley Westwood | Aston Villa | 65 | 2.15 |
| Yohan Cabaye | Crystal Palace | 62 | 2.07 |
Again this result is not new, first being shown by Hang, it has just been updated to incorporate our new framework including the updated second ball chains and higher order balls.
Second Ball Heatmaps
By using the second ball algorithms we can create visuals that show where on the field second balls occur and which result in shots created in the subsequent second ball possession.
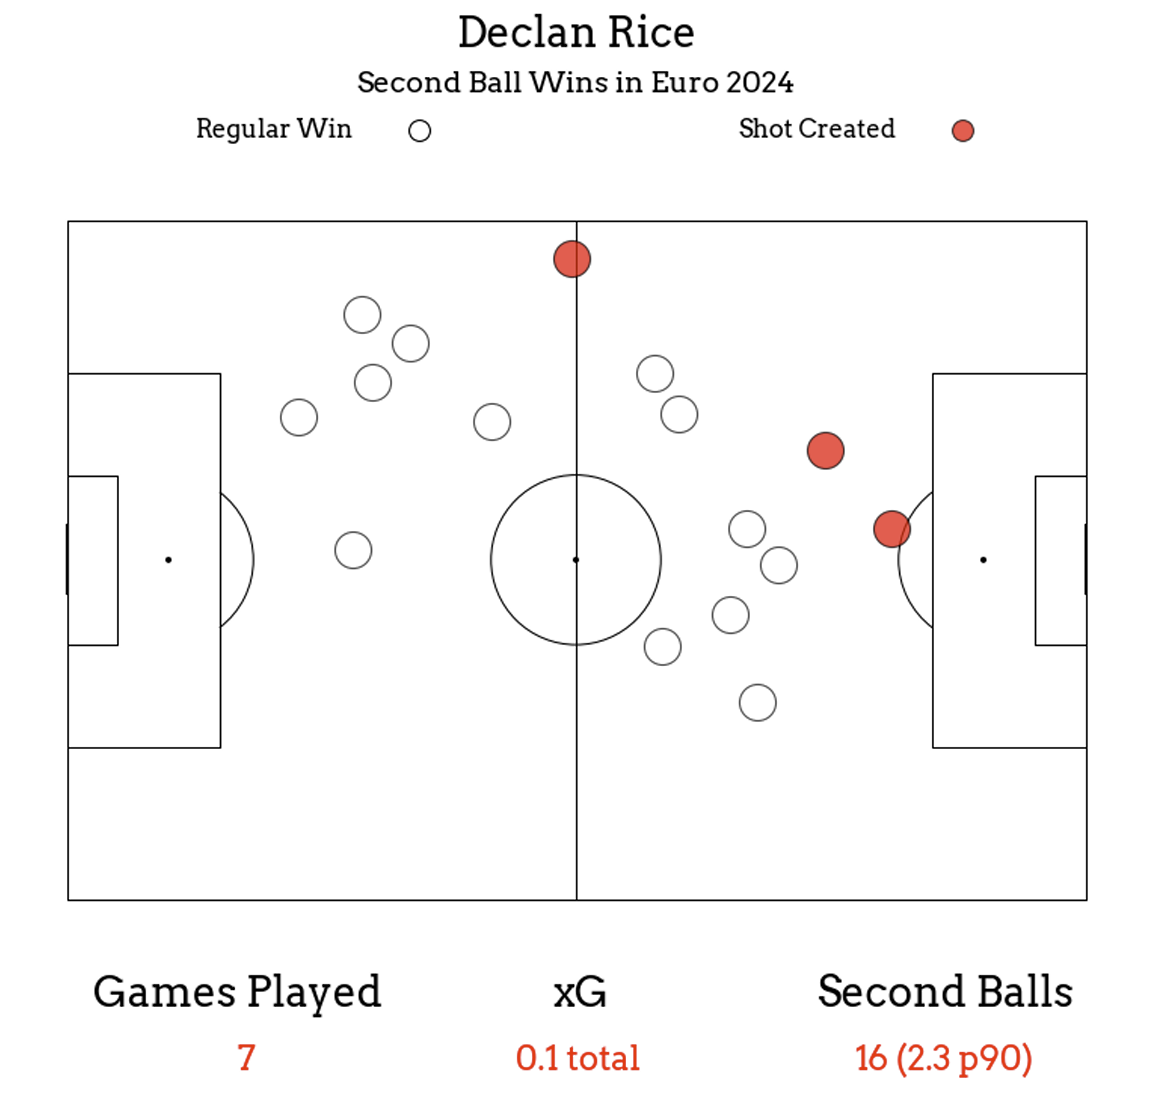
It can also be done for a team, including when they lose a second ball. We can use these maps to visualize players second ball winning habits and which spaces on the pitch they occupy often.
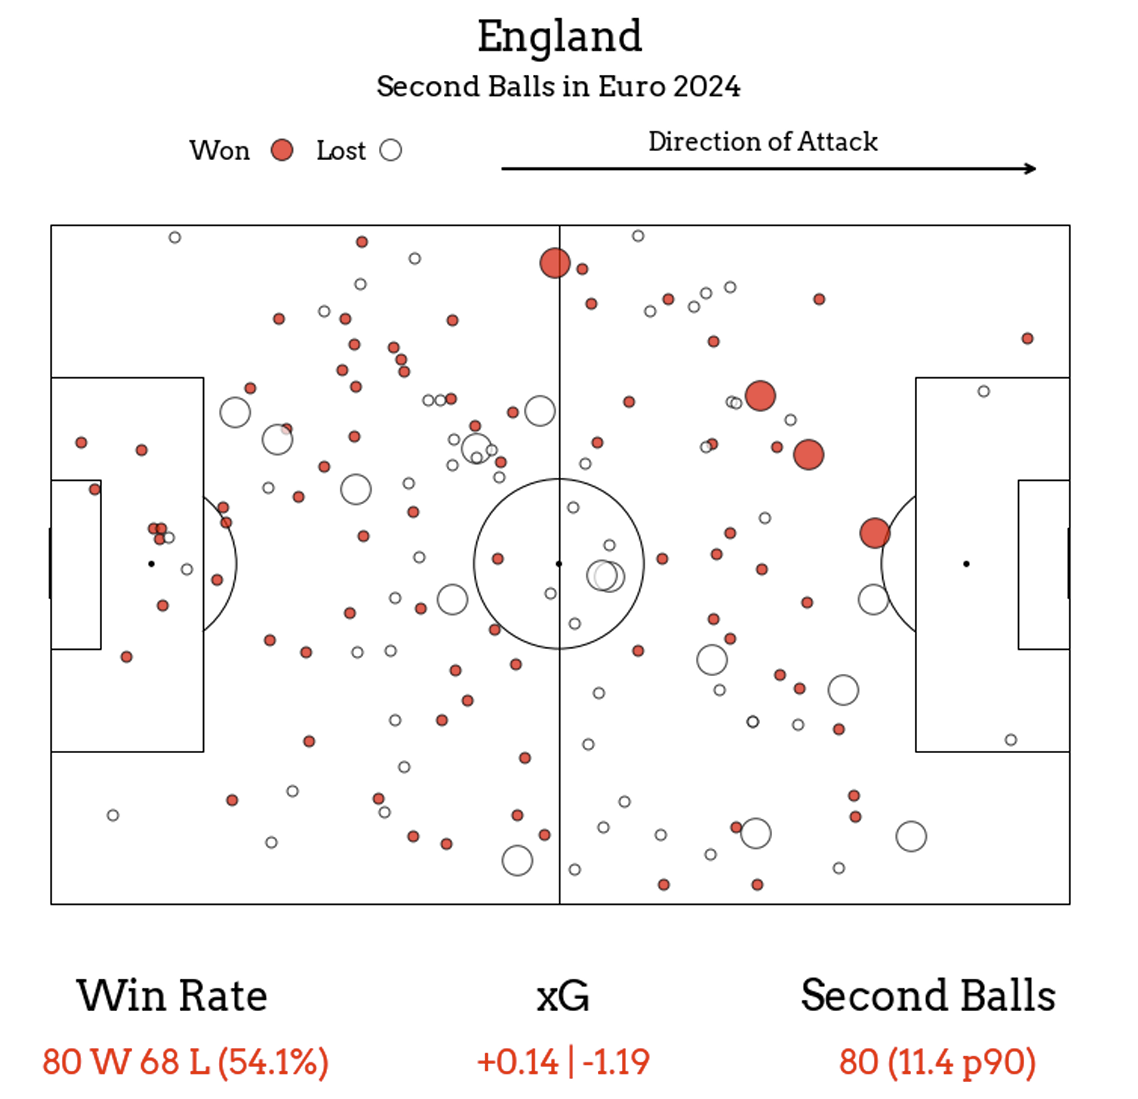
Although England won more second balls than they lost, there were more shots conceded than created. A likely explanation is that since England often dominates possession, opposition may focus on counterattacks through a direct, second ball inducing style of play, with the intention of creating attacking chances quickly after possession regain.
Limitations
Three main limitations in this post should be addressed. The first is the manual annotation of second balls. Event data is not tagged with second balls so only common second ball scenarios that were observed when watching games were recorded. It is very likely we are missing second ball instances. Still, averaging around 24 second balls per game was enough to conduct analysis and create meaningful work, that should only be able to be solidified with updated, improved extraction.
Second, set pieces were not included. Given the differnce in open play and set pieces, they probably would give different results in analysis and due to scope of this work, were not included. Incorporating set pieces would be a natural extension to this work.
Last, only second ball wins were included. So for the visuals and player rankings, it does not include those second balls where possession was not established. This leaves out an important aspect as player second ball winning efficiency could play an important role, i.e, a player winning 5 second balls in 10 attempts vs a player winning 5 in 7 attempts.
While these limitations leave avenues for future work, this work serves as ground work and an intro into the topic.
Conclusions
In this post we investigated quantifying second balls in football. Hang’s framework was built upon, clearing up naming convention confusion as well as introducing higher order balls. Then a mathematical framework was created to allow for conistent extraction of second ball scenarios. Finally player and team statisitics and heatmaps were shown to visualize the quantification of second balls. What has yet to be answered is how second ball wins influence the resulting second ball possesion. Stay tuned for the next post to find out more! Thanks for reading and please feel free to share or leave comments or feedback on Twitter. I am always looking for ways to improve my writing and research skills. Cheers.